Daniel Di Giovanni
Hello! Welcome to my Github Pages website. Here you will find information about me and the projects I have completed.
Project maintained by Danpythonman Hosted on GitHub Pages — Theme by mattgraham
About me
I am currently an engineering student at York University in the process of declaring a major in software engineering. I excelled in the coding courses I took in high school and in university (so far!). I have enjoyed coding as a hobby for a few years, mostly making small applications with GUIs in Python and experimenting with website development in Python and in HTML, CSS, and JavaScript. Listed below are some of my more substantial projects. To make my larger projects available online, and to practice using Git, I have been making GitHub repositories for these projects, which are linked along with each project. I plan on making Git repositories for other projects I have previously completed and adding them to this list. I also plan on adding my future projects here.
My Projects
Sorting Visualization
Link to GitHub repository: https://github.com/Danpythonman/sorting_visualizer
This project is a graphical user interface made with the Tkinter library in Python. It was made after learning about sorting algorithms in a high school computer science course. To visualize sorting algorithms, the user clicks a button to generate a random list of 64 numbers. On screen, these numbers are represented by rectangles, with their heights being proportional to the size of the number. The user can then click a button to sort the list with a specified sorting algorithm. The list is sorted in real-time which can be seen as the rectangles are sorted from shortest to tallest.
Here is merge sort visualized:
And here is selection sort:
Inspirational Website
Link to GitHub repository: https://github.com/Danpythonman/t_web1
Visit the website: https://danpythonman.github.io/t_web1/main.html
This project is an inspirational website in HTML, CSS, and JavaScript that displays a new motivational quote and image every day. The user enters their name when prompted and the site remembers this name. A welcome message is displayed, along with the current time. Under that is the quote of the day. The quote is from the They Said So Quotes REST API. The background image also changes daily, which the website gets from NASA’s Astronomy Picture of the Day API. Each time the user accesses the site, the two APIs are contacted to get the quote and picture, which are then displayed. This is done through JavaScript on the client side.
Automated Plant Watering
Link to GitHub repository: https://github.com/Danpythonman/automated_plant_watering
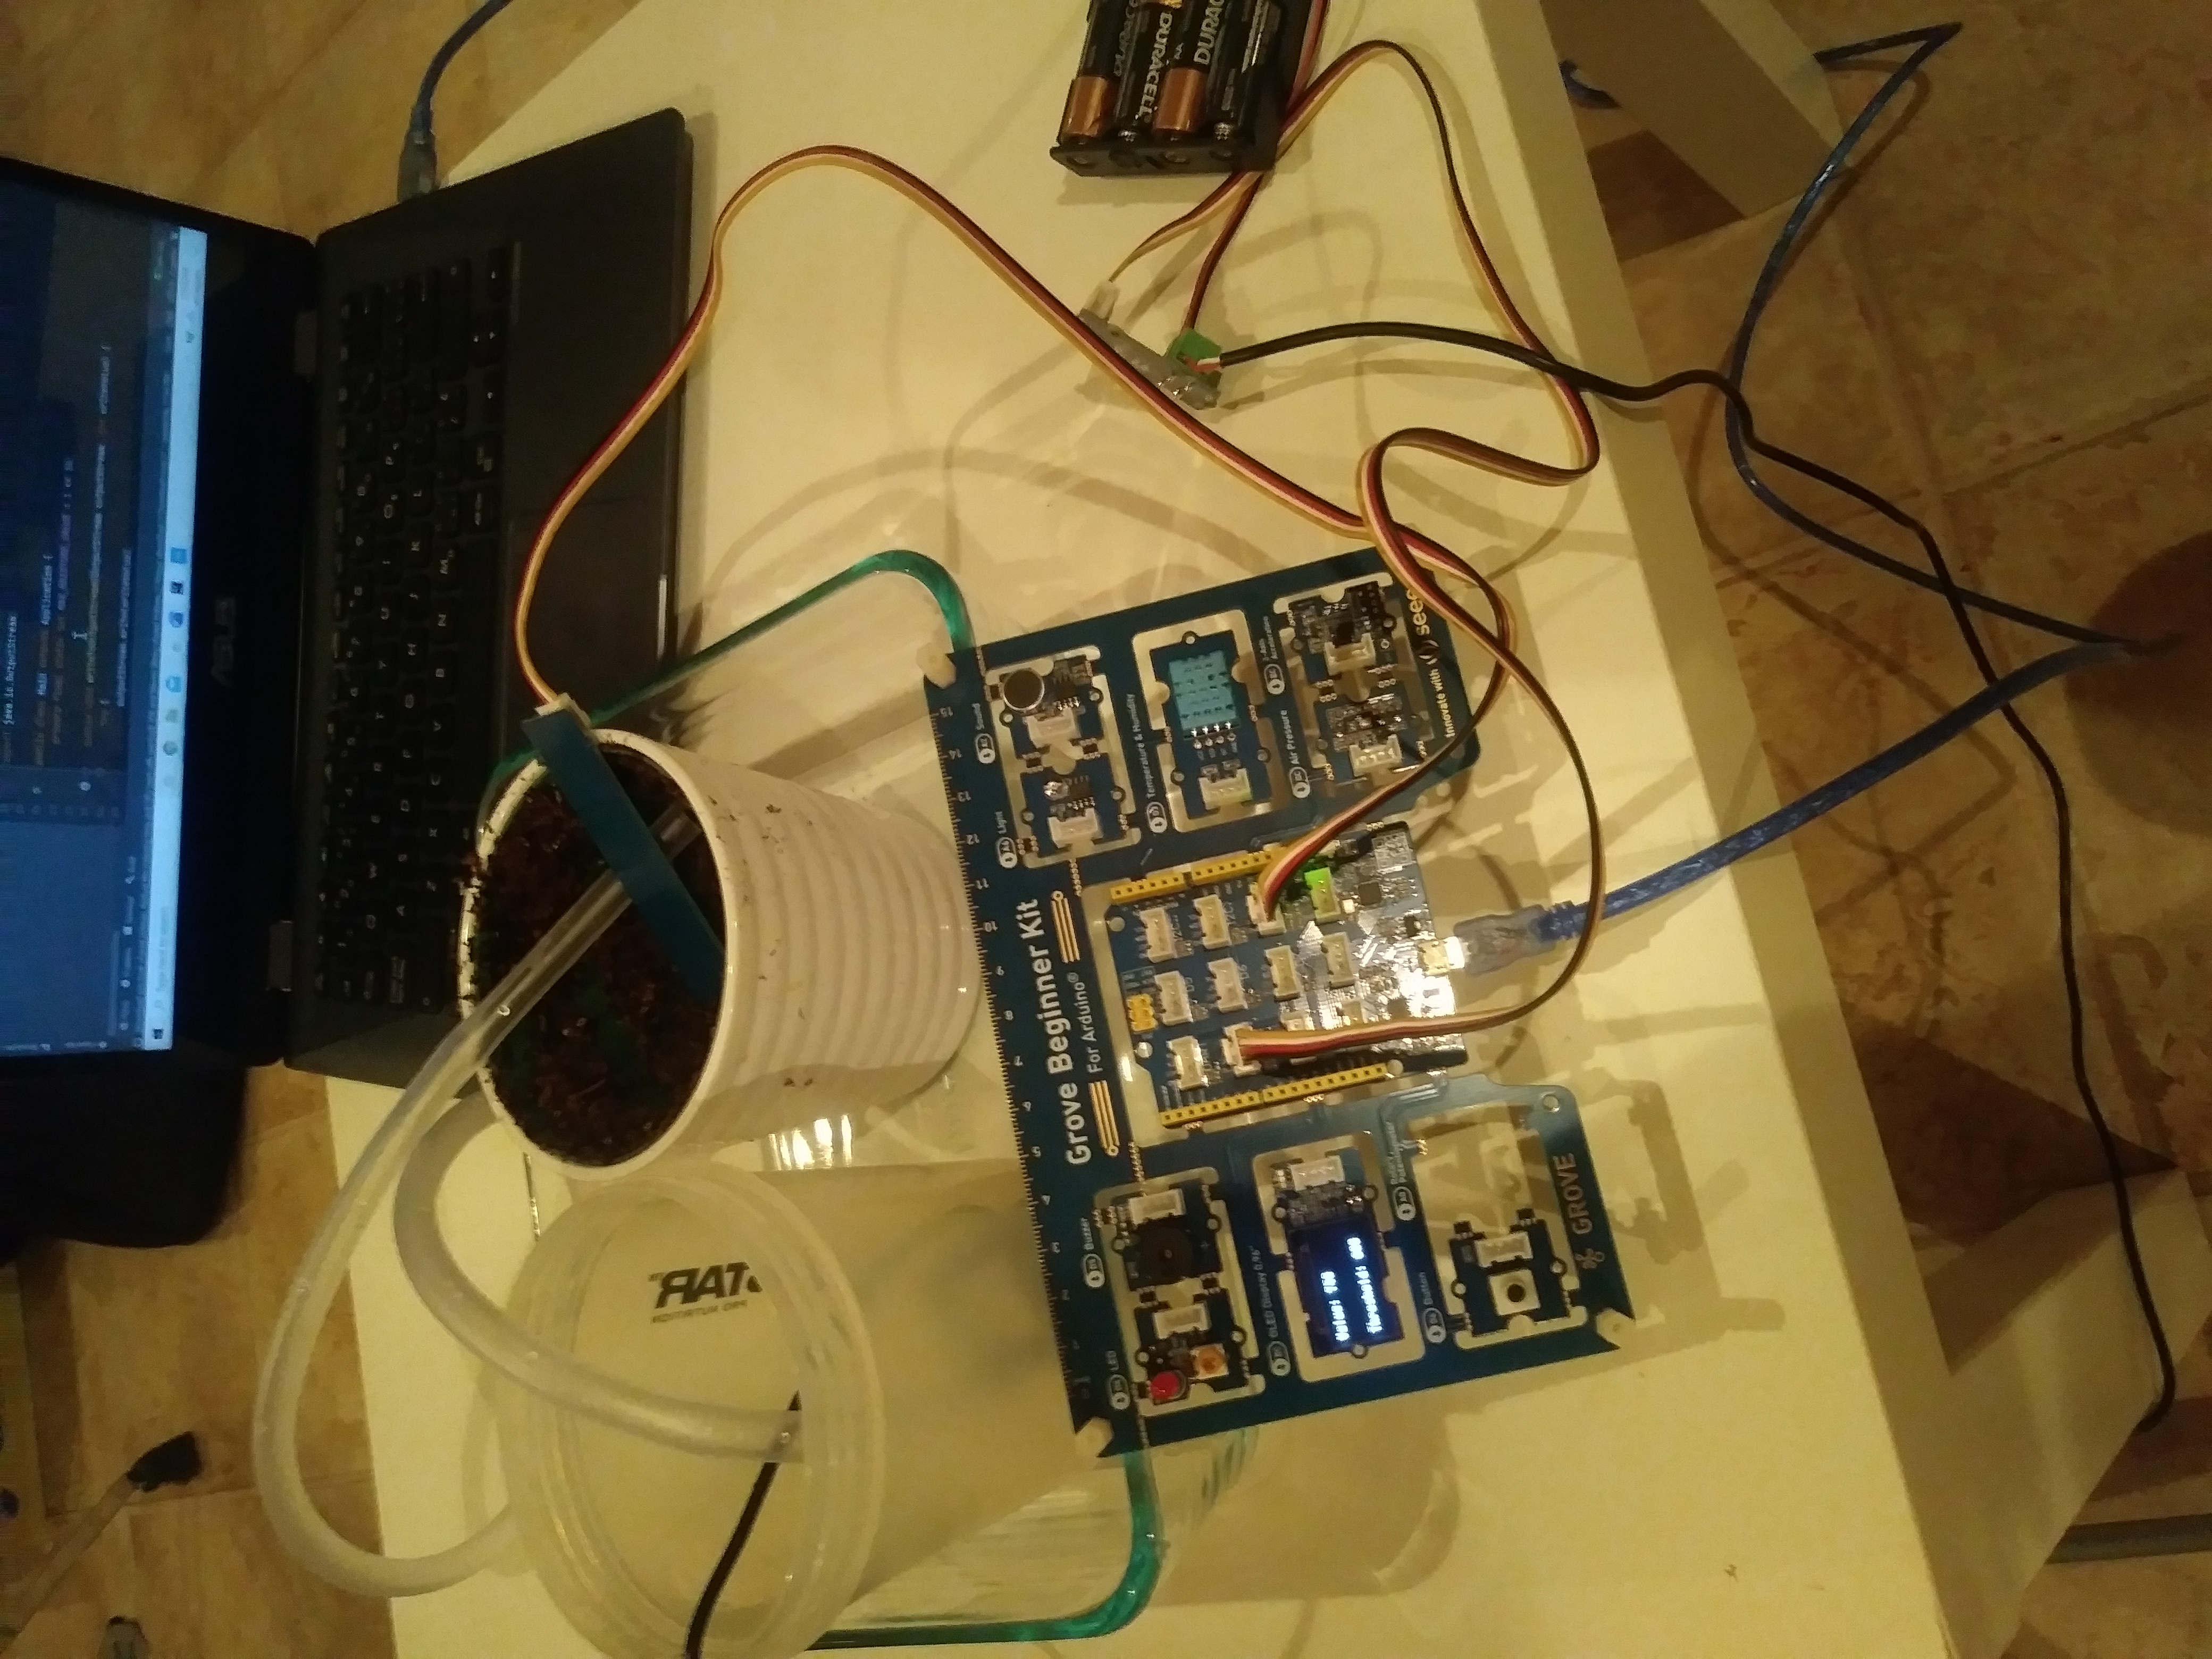
This project, designed to run on an Arduino-compatible board, monitors and waters a plant. This was originally a university project done in C++ and Java, where the Arduino-compatible board would be connected to a computer which sent, processed, and received information through a Java program. I have since refactored it to run without the second computer, so it is now entirely in C++.
The Arduino-compatible board is connected to a moisture sensor and a pump. The sensor is put into the soil and the pump is submerged in water, with the tube outlet pointing to the soil. Among other tasks, like displaying information about the soil’s moisture level on an OLED screen, the program monitors the moisture level of the soil, recognizes when the soil is dry, and activates the pump, watering the plant.
Here is a picture of the setup (when it still required the second computer):
School Time-Tracking Program
Link to GitHub repository: https://github.com/Danpythonman/course_times
This project is a graphical user interface made with the PySimpleGUI library in Python. This project is used to measure how much time someone spends on each course in a semester, which I made so I could better evaluate my study habits. To use this, at the start of a study session or lecture, the user selects the appropriate course and clicks the “Time” button. After finishing studying, the user clicks the “Time” button again and the difference between the start and end times is calculated. The user can also manually add time to a specified course with the “Entry” button. The time spent on each course is saved in JSON files on a weekly basis. The user can view the current week’s times by clicking a button.
Here is what the GUI looks like:
![]()
At the end of the semester, the user can view the data collected throughout the semester in the form of graphs. This is achieved through the Matplotlib library in Python. This part is unfinished, but there are some available options for graphs. For example, here is a pie chart displaying which courses I spent the most time on last semester:
![]()